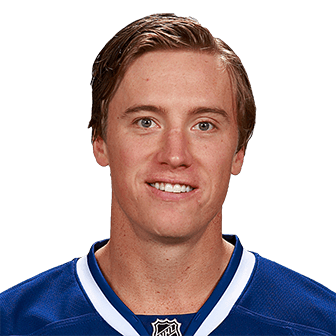


Individual
The player's own numbers, season by season, in the chosen situation.
| Season | Team | GP | TOI | Goals | Total Assists | First Assists | Second Assists | Total Points | IPP | Shots | S% | ixG | iCF | iFF | iSCF | iHDCF | Rebounds Created | PIM | Total Penalties | Minor | Major | Misconduct | Penalties Drawn | Giveaways | Takeaways | Hits | Hits Taken | Shots Blocked | Faceoffs Won | Faceoffs Lost | Faceoffs % |
|---|---|---|---|---|---|---|---|---|---|---|---|---|---|---|---|---|---|---|---|---|---|---|---|---|---|---|---|---|---|---|---|
| 2010–11 | TBL | 18 | 143 | 1 | 2 | 2 | 0 | 3 | 75.0 | 19 | 5.3 | 1.2 | 31 | 22 | 17 | 8 | 0 | 0 | 0 | 0 | 0 | 0 | 3 | 5 | 5 | 12 | 25 | 6 | 46 | 38 | 54.8 |
| 2011–12 | CGY | 21 | 241 | 0 | 2 | 2 | 0 | 2 | 66.7 | 30 | 0.0 | 2.6 | 48 | 37 | 31 | 13 | 3 | 2 | 1 | 1 | 0 | 0 | 5 | 8 | 10 | 24 | 19 | 11 | 77 | 102 | 43.0 |
| 2011–12 | TBL | 22 | 167 | 2 | 2 | 0 | 2 | 4 | 100.0 | 19 | 10.5 | 1.8 | 28 | 25 | 18 | 10 | 1 | 8 | 4 | 4 | 0 | 0 | 4 | 3 | 3 | 23 | 25 | 4 | 23 | 34 | 40.4 |
| 2012–13 | CGY | 15 | 149 | 0 | 1 | 0 | 1 | 1 | 100.0 | 22 | 0.0 | 1.7 | 32 | 26 | 22 | 12 | 1 | 8 | 4 | 4 | 0 | 0 | 3 | 0 | 3 | 22 | 15 | 6 | 53 | 42 | 55.8 |
| 2013–14 | CGY | 14 | 136 | 1 | 0 | 0 | 0 | 1 | 50.0 | 12 | 8.3 | 0.9 | 25 | 17 | 13 | 4 | 0 | 21 | 5 | 3 | 1 | 0 | 4 | 9 | 4 | 30 | 15 | 2 | 32 | 27 | 54.2 |
On ice
What his team did while he was on the ice, season by season.
| Season | Team | GP | TOI | CF | CA | CF% | FF | FA | FF% | SF | SA | SF% | GF | GA | GF% | xGF | xGA | xGF% | SCF | SCA | SCF% | HDCF | HDCA | HDCF% | HDGF | HDGA | HDGF% | MDCF | MDCA | MDCF% | MDGF | MDGA | MDGF% | LDCF | LDCA | LDCF% | LDGF | LDGA | LDGF% | On-Ice SH% | On-Ice SV% | PDO | Off. Zone Starts | Neu. Zone Starts | Def. Zone Starts | On The Fly Starts | Off. Zone Start % | Off. Zone Faceoffs | Neu. Zone Faceoffs | Def. Zone Faceoffs | Off. Zone Faceoff % |
|---|---|---|---|---|---|---|---|---|---|---|---|---|---|---|---|---|---|---|---|---|---|---|---|---|---|---|---|---|---|---|---|---|---|---|---|---|---|---|---|---|---|---|---|---|---|---|---|---|---|---|---|
| 2010–11 | TBL | 18 | 143 | 126 | 101 | 55.5 | 87 | 74 | 54.0 | 69 | 60 | 53.5 | 4 | 6 | 40.0 | 4.0 | 3.72 | 51.8 | 57 | 43 | 57.0 | 22 | 15 | 59.5 | 2 | 3 | 40.0 | 35 | 28 | 55.6 | 1 | 2 | 33.3 | 66 | 53 | 55.5 | 1 | 1 | 50.0 | 5.8 | 90.0 | 95.8 | 26 | 37 | 11 | 133 | 70.3 | 43 | 51 | 22 | 66.2 |
| 2011–12 | CGY | 21 | 241 | 194 | 218 | 47.1 | 136 | 159 | 46.1 | 104 | 104 | 50.0 | 3 | 2 | 60.0 | 7.8 | 8.84 | 47.0 | 87 | 98 | 47.0 | 41 | 36 | 53.2 | 2 | 1 | 66.7 | 46 | 62 | 42.6 | 0 | 1 | 0.0 | 103 | 114 | 47.5 | 1 | 0 | 100.0 | 2.9 | 98.1 | 101.0 | 41 | 48 | 34 | 178 | 54.7 | 65 | 73 | 66 | 49.6 |
| 2011–12 | TBL | 22 | 167 | 123 | 137 | 47.3 | 99 | 99 | 50.0 | 70 | 70 | 50.0 | 4 | 7 | 36.4 | 5.3 | 5.26 | 50.0 | 58 | 57 | 50.4 | 27 | 24 | 52.9 | 4 | 5 | 44.4 | 31 | 33 | 48.4 | 0 | 1 | 0.0 | 63 | 78 | 44.7 | 0 | 1 | 0.0 | 5.7 | 90.0 | 95.7 | 17 | 30 | 25 | 154 | 40.5 | 27 | 49 | 49 | 35.5 |
| 2012–13 | CGY | 15 | 149 | 120 | 141 | 46.0 | 88 | 99 | 47.1 | 65 | 77 | 45.8 | 1 | 7 | 12.5 | 6.1 | 6.18 | 49.7 | 67 | 68 | 49.6 | 34 | 33 | 50.7 | 1 | 4 | 20.0 | 33 | 35 | 48.5 | 0 | 2 | 0.0 | 52 | 71 | 42.3 | 0 | 1 | 0.0 | 1.5 | 90.9 | 92.4 | 24 | 28 | 13 | 136 | 64.9 | 38 | 36 | 44 | 46.3 |
| 2013–14 | CGY | 14 | 136 | 104 | 134 | 43.7 | 64 | 85 | 43.0 | 44 | 52 | 45.8 | 2 | 2 | 50.0 | 3.9 | 4.25 | 48.0 | 42 | 46 | 47.7 | 15 | 20 | 42.9 | 2 | 1 | 66.7 | 27 | 26 | 50.9 | 0 | 1 | 0.0 | 62 | 86 | 41.9 | 0 | 0 | – | 4.5 | 96.2 | 100.7 | 26 | 32 | 20 | 129 | 56.5 | 38 | 41 | 43 | 46.9 |
By situation, 2013–14
On-ice numbers (what the team did while he played) next to his own.
| Situation | TOI | CF% | xGF% | GF | GA | OZS% | G | A | P | S | ixG |
|---|---|---|---|---|---|---|---|---|---|---|---|
| ALL | 159 | 42.3 | 50.6 | 3 | 5 | 54.7 | 2 | 0 | 2 | 14 | 2.1 |
| EV | 137 | 44.0 | 48.5 | 2 | 2 | 56.3 | 1 | 0 | 1 | 13 | 0.9 |
| 5V5 | 136 | 43.7 | 48.0 | 2 | 2 | 56.5 | 1 | 0 | 1 | 12 | 0.9 |
| PP | 4 | 100.0 | 100.0 | 0 | 0 | 100.0 | 0 | 0 | 0 | 0 | 0.0 |
| PK | 15 | 16.7 | 18.6 | 1 | 2 | 11.1 | 1 | 0 | 1 | 1 | 0.3 |
Shot attempts and locations
5-on-5, per 60 minutes, by second of the shift: the player (blue) and the league at his position (grey), seconds 0 to 60 left to right. The map shows his own unblocked attempts, all strengths.
Shot locations
23 unblocked attempts. Darker is more (up to 2 in one cell). The goal is on the right.
Teammates
5-on-5 numbers with each teammate, and the player's numbers when that teammate is off the ice.
| Teammate | TOI together | CF% together | His CF% without | xGF% together |
|---|---|---|---|---|
| Karri Ramo | 73 | 46.7 | 39.8 | 51.1 |
| Reto Berra | 63 | 39.8 | 46.7 | 45.3 |
| Ladislav Smid | 50 | 38.7 | 47.7 | 32.4 |
| Chris Butler | 49 | 37.5 | 47.9 | 45.7 |
| Kris Russell | 47 | 45.9 | 42.7 | 51.7 |
| Paul Byron | 44 | 40.0 | 44.9 | 53.0 |
| TJ Brodie | 41 | 51.7 | 41.1 | 57.4 |
| Mikael Backlund | 37 | 48.4 | 42.0 | 46.4 |
Scoring
Assisted on his 2 goals by
| Player | Total | 1st | 2nd |
|---|---|---|---|
| Lance Bouma | 1 | 1 | 0 |
| Mikael Backlund | 1 | 0 | 1 |
| Paul Byron | 1 | 1 | 0 |
| TJ Brodie | 1 | 0 | 1 |
His 0 assists went to
| Player | Total | 1st | 2nd |
|---|---|---|---|
| No assists | |||